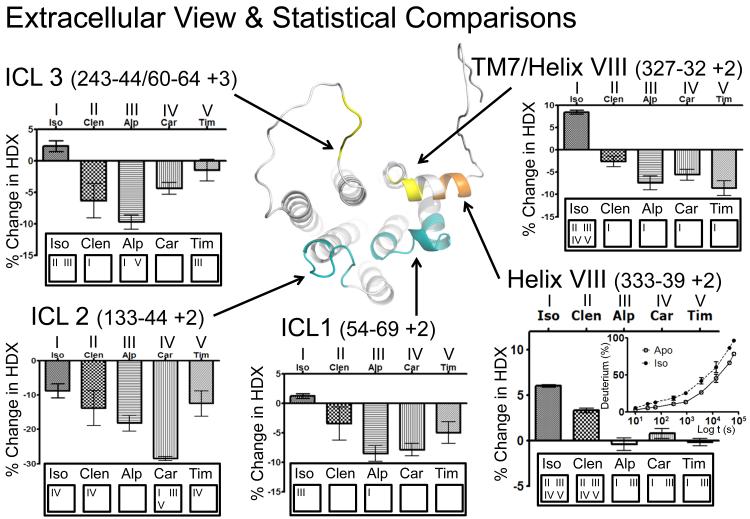
Figure 6.
Intracellular view of a modified structure (see Figure 1 legend) of β2AR. Differential HDX data is shown for selected peptides from five regions of interest at 60s of exchange. The charts are annotated with the results from a Tukey multiple comparison test. Each ligand is assigned a number (at the bottom of each chart) and the numbers above the bars correspond to those ligands that exhibit a significant difference with a Pvalue<0.05. The deuterium uptake plot for the Helix VIII paptide is shown as an insert with that peptide’s statistical analysis. Additional Tukey plots are shown in the Supplemental Information (Figure S6).

