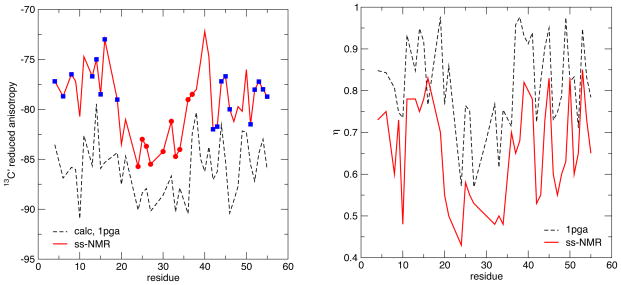
Figure 4.
Comparison of reduced 13C anisotropy (left) and asymmetry (right) for GB1, based on the 1PGA structure and computational model 1. Circles and squares denote regions of helical or sheet secondary structure, respectively. Experimental data is from (Wylie et al, 2007).

