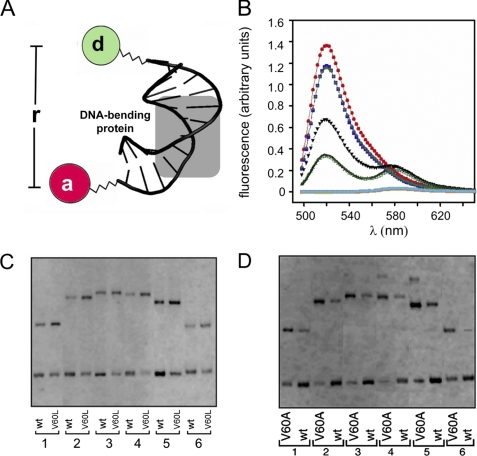
FIGURE 5.
Studies of specific DNA bending. A, schematic illustration of DNA probe design, a central bend reduces distance between respective 5′-ends. One 5′-end is labeled with fluorescein (FAM; donor), and the other 5′ end with TAMRA (acceptor). The bent DNA site was depicted based on the co-crystal structure of the Sox17-DNA complex (29). B, emission spectra of free and bound DNA following excitation at 465 nm. DNA singly labeled is as follows: red, emission of fluorescein donor in free DNA; purple, complex with wild-type (wt) SRY domain; and powder blue, complex with V60L domain (overlapping spectra). Double-labeled DNA is as follows: black triangle, free DNA; green filled triangle, wild-type SRY complex; and green open triangle, V60L SRY complex. Emission spectra of DNA singly labeled with rhodamine acceptor (free, complexed with wild-type SRY and complexed with V60L SRY) are shown in turquoise and underlays. C and D, permutation gel electrophoresis comparing the wild-type and variant SRY domains. The DNA fragments (147 bp) contain consensus site 5′-ATTGTT-3′ (and complement) respectively positioned at 120, 95, 79, 51, 47, and 27 bp from one end. Within experimental error, no differences in bend angles were inferred (see Table 1). In each case the samples (2x for V60A) were loaded side by side on the same gel; for clarity, lanes containing unrelated samples were deleted from the images. See supplemental Fig. S15 for PGE studies of a nonconsensus site.

