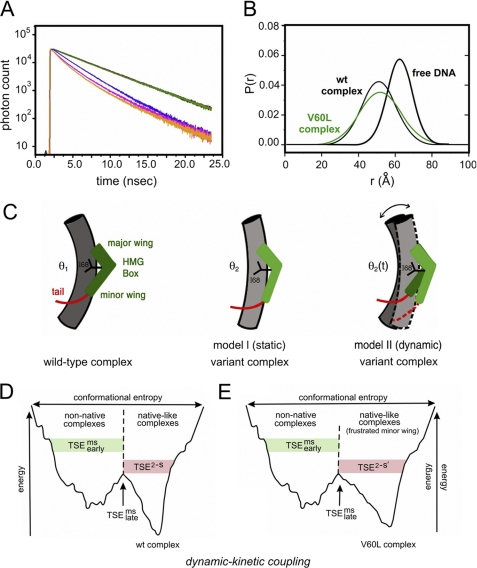
FIGURE 8.
Analysis of SRY-directed DNA bending by time-resolved FRET and distance distribution analysis. A, fluorescence decay of donor bound to 5′-end of model DNA duplex under 490 nm excitation detected at emission wavelength of 520 nm. Singly labeled DNA in absence of acceptor is shown in green; also shown are the donor emission decay in double-labeled DNA in free state (blue) and as complexed with wild-type (wt) SRY (orange) and V60L (red) SRY domains. The reduction of the donor fluorescence lifetime corresponds to the changes in emission spectra because of distance-dependent FRET. B, skewed-gaussian models of end-to-end distances in free and bound DNA sites. End-to-end distance distributions of double-labeled DNA in the free state (black thick line) and as complexed with wild-type (thin black line) and V60L (green) domains. Bending of DNA on binding the SRY domain leads to reductions in the mean of the distributions. The increased width of the bound-state distributions primarily reflects long range conformational fluctuations. C, schematic models of bent protein-DNA complexes. Left, human SRY domain-DNA complex showing L-shaped HMG box (green), C-terminal basic tail (red), cantilever side chain Ile-68 (black), and bent DNA (gray cylinder). Center, corresponding model of a variant SRY complex depicting static DNA bend at lower set point (θ2 < θ1). Right, by contrast, the V60L substitution is proposed to enhance fluctuations in DNA bend angle (bi-directional arrow) and structure of HMG box (light and dark green) such that the root mean square deviation in bend angle is increased whereas mean bend angle (θ2(t)) is similar to that of native set point θ1. This panel was adapted from Ref. 34. D and E, kinetic-dynamic coupling based on double-funnel projection model of free-energy landscapes. D, wild-type SRY-DNA complex; E, V60L complex. In each case the width of the funnel represents the conformational entropy and its depth the energy of interaction between SRY and its target DNA site. The top corresponds to the free macromolecules; the rugged funnel at left depicts nascent non-native protein-DNA interactions; and the smoother funnel at right represents the minimal frustration of the native complex. V60L leads to frustrated induced fit in the native-like funnel. Kinetics of dissociation represent parallel channels as follows: multistate kinetic routes via the frustrated funnel versus two-state kinetic route via the minimally frustrated native funnel, each with its own transition state ensemble. TSEms early (multistate; green shading) indicates transition-state ensemble leading to the non-native funnel; TSEms late (multistate) indicates multistate transition state ensembles between funnels; TSE2−S (two-state; red shading) indicates transition state ensemble in the direct channel to or from the native-like funnel. Landscape scheme was adapted from Sánchez et al. (93).

