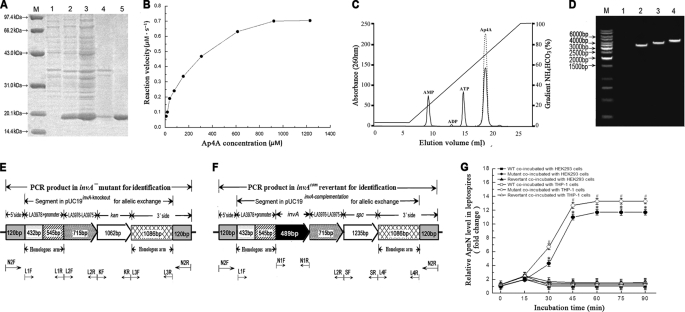
FIGURE 1.
Expression of leptospiral rInvA, identification of invA− mutant and invAcom revertant, and Nudix hydrolase activity of the rInvA. A, expression and purification of rInvA protein of wild type of L. interrogans strain Lai. Lane M, protein marker (BioColor); lane 1, pET42a without invA gene insertion; lane 2, expressed rInvA induced with 1.0 mm IPTG at 28 °C; lanes 3 and 4, presence of rInvA in the bacterial supernatant and precipitate after ultrasonication; lane 5, rInvA purified by Ni-NTA affinity chromatography. B, Michaelis-Menten plot for the hydrolysis of Ap4A caused by the leptospiral rInvA. C, HPLC elution profiles of products of Ap4A caused by the leptospiral rInvA. A reaction mixture containing 50 mm Tris-HCl, pH 9.0, 1 mm substrate, 5 mm Mg2+ with or without 0.05 μm of the leptospiral rInvA was incubated for 20 min at 37 °C. The samples were analyzed on a 1-ml Resource Q column at a flow rate of 2 ml/min in 35 mm NH4HCO3, pH 9.6. The products were eluted and separated by an 18-min gradient elution from 5% to 100% with 0.7 m NH4HCO3. The proportion of hydrolyzed substrate was calculated by dividing the peak areas from the samples lacking the leptospiral rInvA (dotted line) by the samples containing the leptospiral rInvA (solid line). D, PCR results for identification of the invA− mutant and invAcom revertant. Lane M, DNA ladder (TaKaRa); lane 1, blank control; lanes 2, the amplicon (3506 bp) of LA3978-invA-LA3976-LA3975–1086-bp segment (3266 bp) plus two extending regions from the 5′ (120 bp) and 3′ sides (120 bp) from wild type of L. interrogans strain Lai as the control; lanes 3, the amplicon (4080 bp) of LA3978-LA3976-LA3975-kan-1086bp segment (3840 bp) plus the two 120-bp extending regions from the invA− mutant for identification; lanes 4, the amplicon (4741 bp) of LA3978-invA-LA3976-LA3975-spc-1086bp segment (4501 bp) plus the two 120-bp extending regions from the invAcom revertant for identification. The amplicons in lanes 2–4 were amplified using the same primers N2-F/N2-R. E, schematic diagram of the sequencing result of the invA− mutant. The positions of PCR primers were marked below. F, schematic diagram of the sequencing result of the invAcom revertant. The positions of PCR primers are marked below. G, relative ApnN levels in the invA− mutant, invAcom revertant, and wild type (WT) of L. interrogans strain Lai during infection. The relative ApnN levels in the invA− mutant, invAcom revertant, and wild type L. interrogans strain Lai during infection of host cells for the indicated incubation times are expressed as -fold changes compared with each of the leptospires in media before infection (incubation time = 0), which was set as 1.0. * and #: p < 0.05 versus the wild type.

