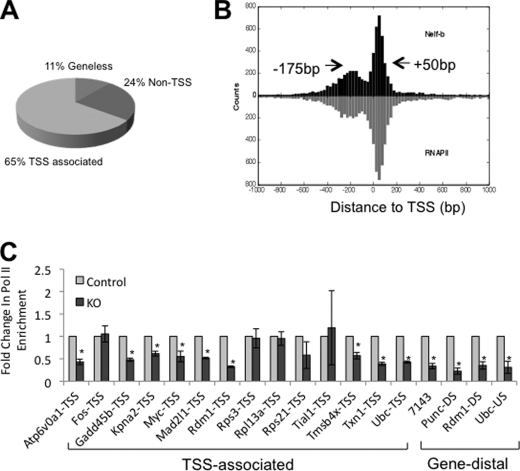
FIGURE 2.
Global picture of Nelf-b chromatin occupancy in the mouse genome. A, pie chart indicating the different categories of Nelf-b binding regions with various distances to annotated TSS. B, composite profile of Nelf-b and pol II chromatin occupancy aligned to TSS. Arrows indicate the peak position. C, pol II ChIP at Nelf-b binding sites in control and KO MEFs. At each locus tested, the level in the control sample was set as 1 and that in the KO cells was expressed as fold change over the control. Results shown were average of three experiments. Error bar stands for S.E. Asterisk indicates p value < 0.05.

