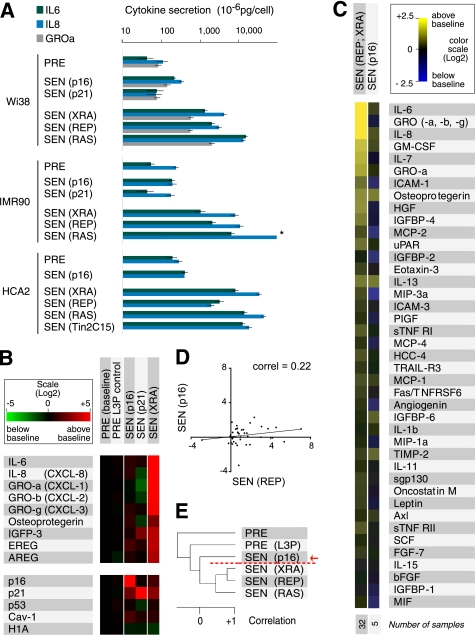
FIGURE 1.
p16INK4a and p21CIP1/WAF1 induce a distinct secretory profile. A, ELISA measurements of IL-6, IL-8, and GROα. We analyzed CM from the indicated presenescent (PRE) cell strains and cells induced to senesce (SEN) by p16INK4a (p16) or p21CIP1/WAF1 (p21) overexpression, irradiation (XRA), replicative exhaustion (REP), or oncogenic RASV12 (RAS). CM from untreated and control-infected PRE cells were pooled. The asterisk denotes a value higher than the limit of the scale (see supplemental Fig. 1B for additional ELISA data, including GROα). B, mRNA profiles of p16INK4a- and p21CIP1/WAF1-induced senescent cells. TaqMan PCR was used to quantify the indicated mRNAs in PRE WI-38 and IMR-90 cells (baseline, n = 15; WI-38 = 9 and IMR90 = 6), PRE cells infected with an insertless lentivirus (PRE L3P, n = 5; WI-38 = 3, and IMR90 = 2), cells made senescent by infecting with lentiviruses that overexpress p16INK4a (p16, n = 5; WI-38 = 3 and IMR90 = 2) or p21CIP1/WAF1 (p21, n = 2; IMR90 = 2), and x-ray-induced senescent cells (XRA, n = 8; WI-38 = 5 and IMR90 = 3) (see also supplemental Fig. 1C). C, secretory profile of p16INK4a-induced senescent cells. CM from cells induced to senesce by p16INK4a overexpression (p16) were analyzed by antibody arrays and compared with replicatively or x-ray-induced senescent cells (REP; XRA). Signals from WI-38 and IMR-90 cells were averaged, and the PRE secretory profile was used as baseline. Log2 fold variations from the baseline are color-coded (yellow, signals higher than baseline; blue, signals below baseline). The 41 factors previously identified as significantly changed between PRE and SEN cells are shown (12). The number of samples analyzed is shown on the right. D, correlation between the secretory profiles of REP and p16INK4a-induced senescent (p16) cells. The trend line corresponds to the linear regression comparing the two populations (correlation = 0.22, slope = 0.12). E, unsupervised hierarchical clustering analysis of secretory profiles of PRE and SEN WI-38 cells, using all 120 factors interrogated by the antibody arrays. SEN(p16) cells cluster away from SEN(XRA), SEN(REP) or SEN(RAS) cells (red arrow and broken line).

