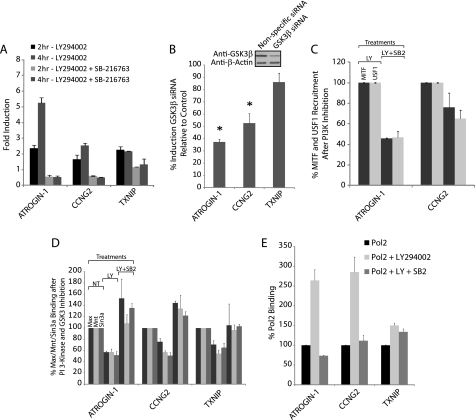
FIGURE 9.
GSK3 promotes expression of E-box-regulated genes. A, proliferating T98G cells were treated with LY294002 with or without the GSK3 inhibitor SB-216763. Data are presented as fold-induction for each gene, compared with cells treated with DMSO vehicle control, at 2 and 4 h of PI 3-kinase inhibition and represent the mean ± S.E. of 2 independent treatments. B, induction of the E-box-regulated genes after GSK3β siRNA knockdown. T98G cells were transfected with either GSK3β siRNA or nonspecific control siRNA as in Fig. 3B. Knockdown of GSK3β protein was ∼50% (see inset). Data are the mean ± S.E. of 4 independent transfections. The induction of ATROGIN-1 and CCNG2 was significantly lowered after GSK3β knockdown (*, p < 0.05). C, ChIPs with MITF or USF1 antibodies from T98G cells treated for 30 min with either LY294002 (LY) or LY294002 + SB-216763 (LY + SB2). Data are the percentage of MITF and USF1 binding for LY + SB2 compared with LY and are the mean ± S.E. of 2 and 3 independent determinations for MITF and USF1, respectively. D, ChIPs with Max, Mnt, and Sin3a antibodies from T98G cells treated for 30 min with DMSO (no treatment, or NT), LY294002 (LY), or LY294002 + SB-216763 (LY + SB2). Data are the percentage of Max, Mnt, and Sin3a binding compared with the vehicle control and are the mean ± S.E. of 3 independent determinations. E, ChIPs with Pol II antibodies, quantified by PCR using primers at the transcription start sites. Data are the percentage of Pol II binding compared with the vehicle control and are the mean ± S.E. of 2 independent determinations.

