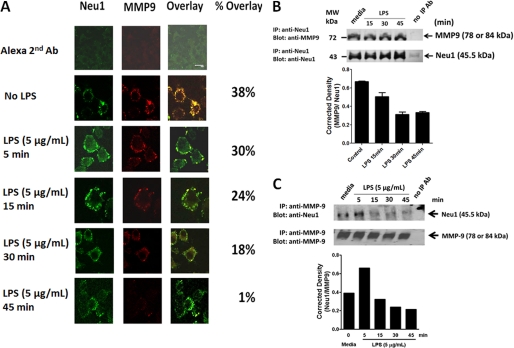
FIGURE 10.
A, MMP9 colocalizes with Neu1. BMA macrophage cells were treated with 5 μg/ml LPS for 5, 15, 30, and 45 min or left untreated as controls. Cells were fixed, non-permeabilized, and immunostained with rabbit anti-Neu1 (H-300, Santa Cruz Biotechnology, Inc.) and goat anti-MMP9 (C-20, Santa Cruz Biotechnology, Inc.) followed by Alexa Fluor568 rabbit anti-goat IgG or Alexa Fluor488 donkey anti-rabbit IgG. Stained cells were visualized using a confocal inverted microscope (Leica TCS SP2 MP inverted confocal microscope) with a ×100 oil objective. Images were captured using a z-stage of 8–10 images/cell at 0.5-mm steps and were processed using ImageJ version 1.38x software. To calculate the amount of colocalization in the selected images, the Pearson correlation coefficient was measured and expressed as a percentage using ImageJ version 1.38x software. The data are a representation of one of three independent experiments showing similar results. MMP9 co-immunoprecipitates with Neu1 (B), and conversely, Neu1 co-immunoprecipitates with MMP9 (C). BMA macrophage cells were left cultured in medium or in medium containing 5 μg/ml LPS for the indicated time intervals. Cells (1 × 10⁷ cells) were pelleted and lysed in lysis buffer. MMP9 and Neu1 in cell lysates from BMA cells were immunoprecipitated with 1.0 μg of goat anti-MMP9 or 1 μg of rabbit anti-Neu1 antibodies for 24 h. Following immunoprecipitation, complexes were isolated using protein A or G magnetic beads, washed 3 times in buffer, and resolved by 8% SDS-PAGE. The blots were probed for MMP9 (78 or 84 kDa) with anti-MMP9 or Neu1 (45.5 kDa) with anti-Neu1 antibodies followed by Clean-Blot IP Detection Reagent for immunoprecipitation/Western blots and Western Lightning Chemiluminescence Reagent Plus. The chemiluminescence reaction was analyzed with x-ray film. Sample concentration for gel loading was determined by Bradford assay. Quantitative analysis was done by assessing the density of Neu1 or MMP9 bands corrected for background in each lane using Corel Photo Paint 8.0 software. Each bar in the graphs represents the mean ratio corrected density of the Neu1 band over the MMP9 band for 6–8 replicate measurements within each lane. The data are a representation of one of three independent experiments showing similar results. Error bars, S.E. IP, immunoprecipitation.

