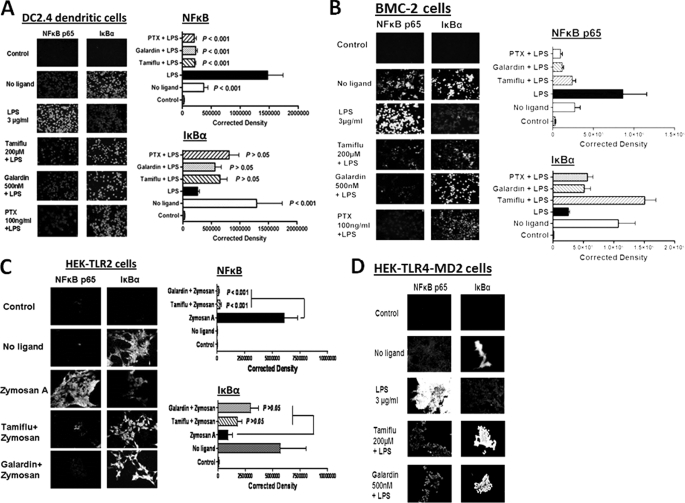
FIGURE 3.
A, LPS-induced NFκB activation and IκB degradation in DC2.4 dendritic cells. DC2.4 cells were pretreated with 200 μm Tamiflu, 500 nm galardin, 100 ng/ml PTX for 30 min followed by 3 μg/ml LPS for 15 min. Cells were fixed, permeabilized, and immunostained with rabbit anti-NFκBp65 or rabbit anti-IκBα followed by Alexa Fluor594 rabbit anti-goat IgG. Stained cells were visualized by epifluorescence microscopy using a ×40 objective. Approximately 95% of LPS-treated cells immunostained with NFκBp65 had nuclear staining. Quantitative analysis was done by assessing the density of cell staining corrected for background in each panel using Corel Photo Paint 8.0 software. Each bar in the graphs represents the mean corrected density of staining ± S.E. (error bars) for all cells within the respective images. The control group was immunostained with only Alexa Fluor594 secondary goat anti-rabbit IgG. p values represent significant differences at 95% confidence using the Dunnett multiple comparison test compared with LPS-treated cells. The data are a representation of one of three independent experiments showing similar results. B, LPS-induced NFκB activation and IκB degradation in BMC-2 macrophage cells. Cells were cultured and treated as described in A. C, zymosan A-induced NFκB activation and IκB degradation in HEK-TLR2 cells. Cells were pretreated with 200 μm Tamiflu or 500 nm galardin for 30 min followed by 66.7 μg/ml zymosan A for 15 min. Cells were fixed, permeabilized, and immunostained as described in A. D, LPS-induced NFκB activation and IκB degradation in HEK-TLR4/MD2 cells. Cells were cultured and treated as described in A.

