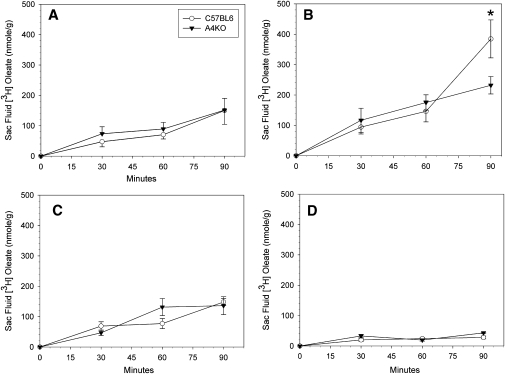
Fig.4.
Regional secretion of [3H]oleate into gut sac fluids in C57BL6 (○) and A4KO (▾) mice. Data points are means ± SEM, n = 3-10. Data points at each time marked with an asterisk are significantly different at P = 0.001 between the two stains by ANOVA. Panel A, duodenum; panel B, jejunum I; panel C, jejunum II; panel D. ileum.

