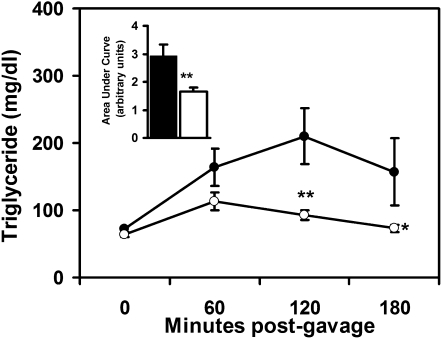
Fig. 5.
Postprandial plasma lipid response to a bolus lipid-rich meal. The Pla2g1b+/+ (solid symbols) and Pla2g1b (−/−open symbols) mice were placed on a hypercaloric diet for three weeks. Fasting animals were fed 400 µl of olive oil by intragastric gavage. Plasma triglyceride levels were measured at hourly intervals as indicated. The inset shows AUC calculations. Results represent mean ± SE from six Pla2g1b+/+ and ten Pla2g1b−/− mice. *P ≤ 0.05, **P ≤ 0.01 versus Pla2g1b+/+ mice.

