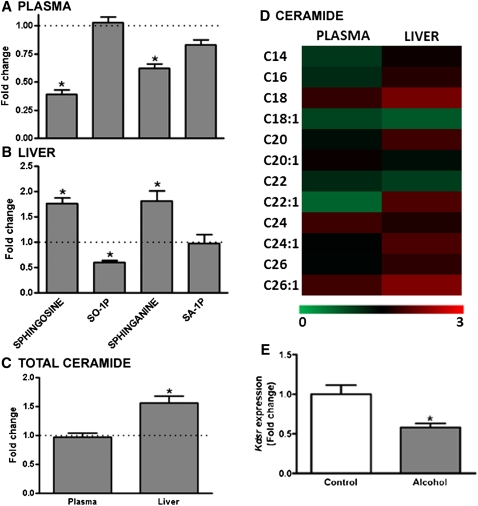
Fig. 4.
Relative levels of sphingolipids in the plasma and liver of alcohol-fed mice. (A) Plasma levels of sphingosine and sphinganine were significantly lower in alcohol-fed mice (n = 11) relative to control mice (n = 8), with no change in SO-1P or SA-1P observed. (B) Liver levels of sphingosine and sphinganine were higher in alcohol-fed mice, whereas SO-1P was decreased, and SA-1P was unchanged. (C) Total ceramide levels were unchanged in the plasma of alcohol-fed mice; however there was a significant increase in total ceramide in the liver. (D) A heat map showing relative changes in individual ceramide molecules with different fatty acyl chain lengths is shown for plasma (left column) and liver (right column). (E) Kdsr expression is decreased in the liver of alcohol-fed mice. All data are means ± SEM. *P < 0.05 alcohol-fed versus control mice.

