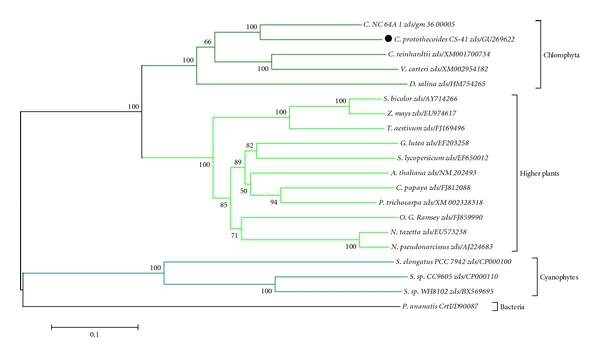
Figure 6.

Phylogenic tree of the zds sequences from various species. The phylogeny was derived using Neighbor-joining analysis. Bootstrap values >50% are indicated near the base of each branch (1000 replicates). Horizontal branch lengths represent relative evolutionary distances with the scale bar corresponding to 0.1 amino acid substitutions per site.
