
Fig. 1.
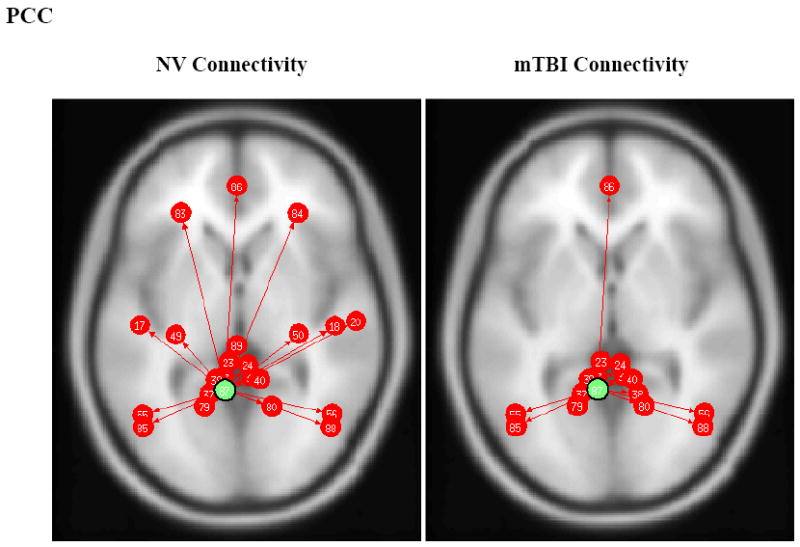
PCC ROI based connectivity maps for NV (left) and mTBI (right) subjects. Green dot designates the PCC ROI seed and red arrows and dots indicate significant positively correlated (p<0.05 FDR) brain regions (note image produced from CONN toolbox and numbers do not represent Brodmann’s Area numbers). Left and Right Inferior Temporal Gyrus (#17/18), Left and Right Parahippocampal Gyrus (#49/50), Left and Right Angular Gyrus (#55/56), Left and Right Dorsolateral Prefrontal Cortex (#83/84), and Medial Prefrontal Cortex (#86).