
Fig 1.
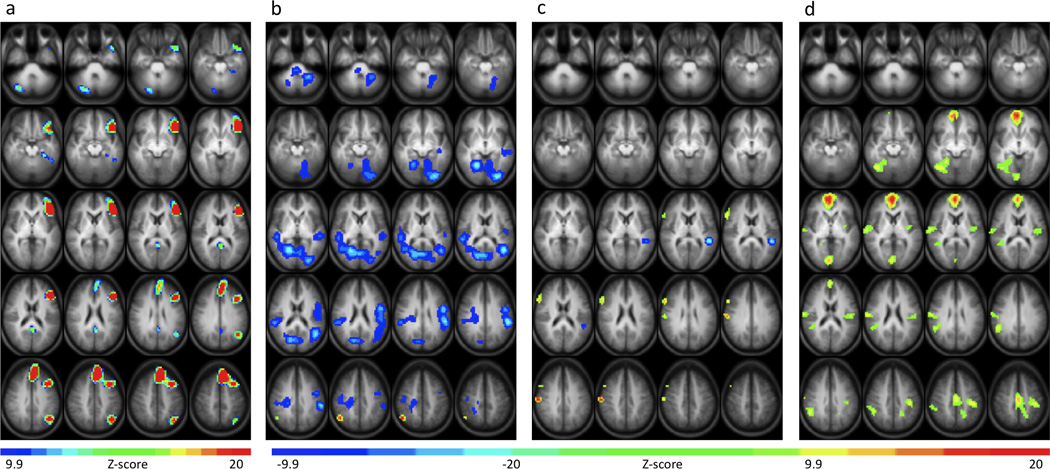
Group z-score maps showing areas of increased BOLD signal during the semantic decision condition compared to the tone decision conditiona and clusters of significant positive and negative activation associated with increased performance on the semantic decision condition of the SDTD taskb, Semantic Fluency Testc, and Boston Naming Testd. Maps are presented in radiological convention with left on the picture corresponding to the right hemisphere. The 20 axial slices selected range in Talairach coordinates from z = −29 mm to z = +47 mm.