Fig. 2.
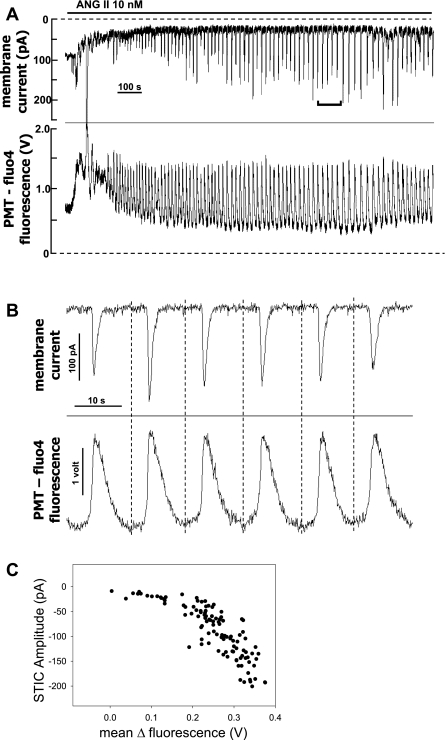
Cytoplasmic calcium ([Ca2+]CYT) oscillations are synchronous with ANG II-induced STICs. A–C: results of simultaneous membrane current and fluo-4 [Ca2+]CYT variations in a single cell exposed to ANG II (10 nmol/l). A: full record shows initial ANG II application that elicits both an increase in inward current (top) and rise of [Ca2+]CYT (fluo-4 fluorescence; bottom) followed by stabilization to persistent oscillations. Fluorescence was quantified as photomultiplier (PMT) output in volts. The inverted bracket in the top shows the region expanded in B. B: time-expanded region from A shows synchronous oscillations of current (top) and fluo-4 [Ca2+]CYT (bottom). Vertical broken lines were drawn by eye at the time of onset of the rise of [Ca2+]CYT. [Ca2+]CYT elevations precede onset of inward current variations. C: plot of STIC amplitude vs. maximal change in fluo-4 fluorescence for the record in A. Results are similar to 10 other cells subjected to simultaneous current and fluorescent recordings.

