Fig. 3.
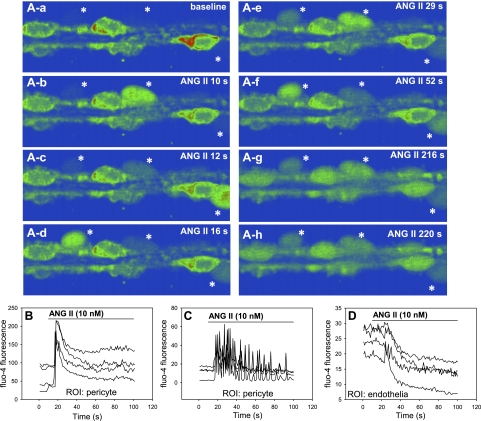
Confocal recording of ANG II-induced [Ca2+]CYT oscillations in descending vasa recta (DVR) pericytes. Confocal recording of fluo-4 fluorescence in a DVR fixed to a coverslip and exposed to ANG II. Aa–Ah: pseudocolor serial images recorded at times of ANG II exposure indicated in the top right corner of each panel. Concentration of [Ca2+]CYT increases from blue to green to red. Asterisks indicate the locations of 3 pericyte cell bodies that only become visible in some panels during asynchronous oscillations. Also note the progressive decline of fluo-4 fluorescence of endothelial cells that line the lumen of the sequential images. The vessel is ∼12 μm in diameter. B: examples of recordings in which [Ca2+]CYT oscillations do not occur. Regions of interest (ROI) were set to quantify fluorescence of pericyte cell bodies. C: ROI corresponding to pericyte cell bodies in a recording where [Ca2+]CYT oscillations take place. D: quantification of ANG II-induced suppression of endothelial [Ca2+]CYT. ROI were set to measure fluo-4 fluorescence from endothelial cell bodies.

