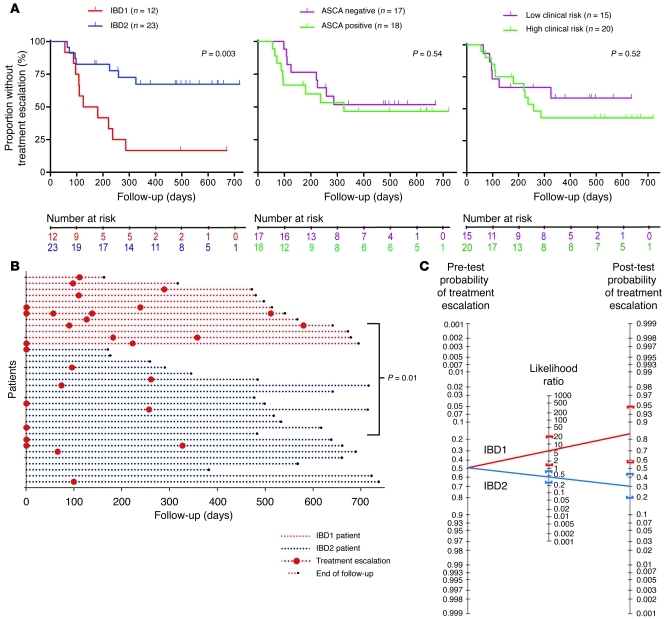
Figure 2. CD patients in subgroups IBD1 and IBD2 have significantly different disease courses.
(A) Kaplan-Meier survival curves demonstrating the proportion of CD patients who did not require a subsequent treatment escalation (immunomodulator or surgery) after enrollment, as stratified by IBD1/2 subgroup (left) and ASCA serology (middle) and clinical parameters associated with complicated disease (right). Clinical parameters included age of less than 40 years at diagnosis, initial requirement for steroids, and perianal involvement. High risk of complicated disease was defined as 2 or more of these parameters; low risk was defined as fewer than 2 of these parameters. Statistical significance was determined using a log-rank test (df). Number at risk refers to the number of uncensored patients at each time point who remained at risk of requiring a treatment escalation. (B) Disease courses of all CD patients (y axis). The color of dotted lines reflects subgroup designation. In cases in which multiple treatment escalations are indicated, this universally reflects ongoing disease activity rather than intolerance to the initial treatment. Statistical significance was determined using a Fisher’s exact test (2 df). (C) Bayes’ nomogram demonstrating the effect that stratifying the CD cohorts by the IBD1/2 signature would have had upon the predicted requirement for treatment escalation: prior probability of treatment escalation, 48.6%; positive likelihood ratio, (sensitivity/[1-specificity]) 5.29 (95% CI, 1.35–21); negative likelihood ratio, ([1-sensitivity]/specificity) 0.46 (95% CI, 0.26–0.84); post-test probabilities, IBD1, 83% (95% CI, 56%–95%), and IBD2, 30% (95% CI, 20%–44%).

