Fig. 5.
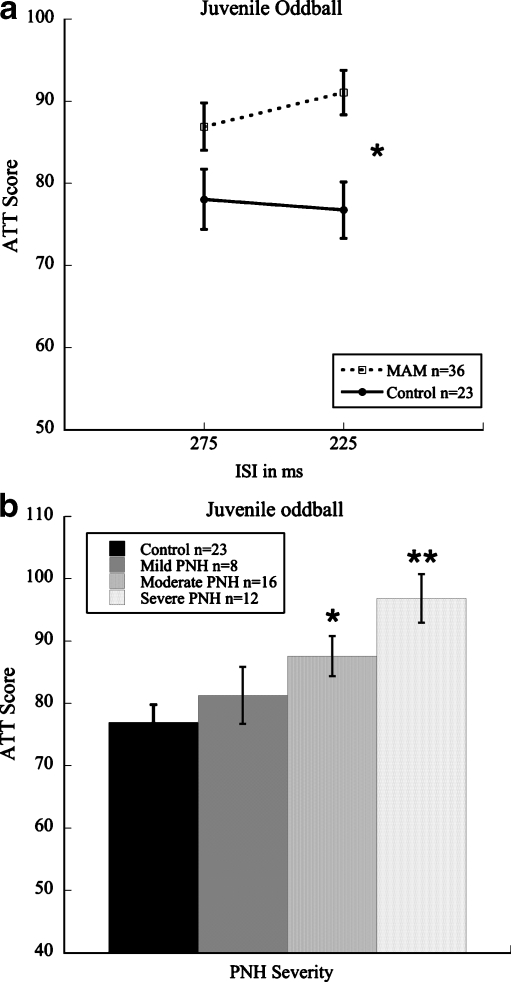
Graphs showing: (a) significant difference between MAM treated and control subjects on the 275 and 225 ms ISI oddball task; and (b) combined juvenile oddball performance for the three PNH severity groups (mild, moderate and severe) and control rats, showing significant deficits in moderate and severe PNH conditions (*p < .05, **p < .01; values reflect NST covariate)

