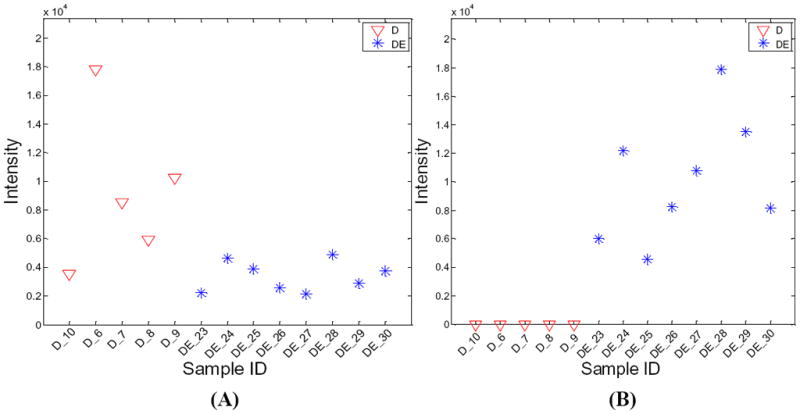
Figure 4.

Regulation changes of two metabolites in two different physiological conditions. (A) shows the regulation change of a metabolite with a MetSign identity of C37H58O10-[M+Na+]-2H-1. The abundance test (pair-wise t-test) shows that the regulation of this metabolite in the sample group DE is up-regulated with a fold change of 2.7 and a p-value of 0.0116. (B) shows the regulation change of a metabolite with a MetSign identity of C45H88N1O13-[M+K+]-2H-12. This metabolite was not detected in the sample group D and the abundance test could not be applied. The Fisher s exact test shows that this metabolite has different regulation between the sample group D and the sample group DE with p-value of 0.0008.
