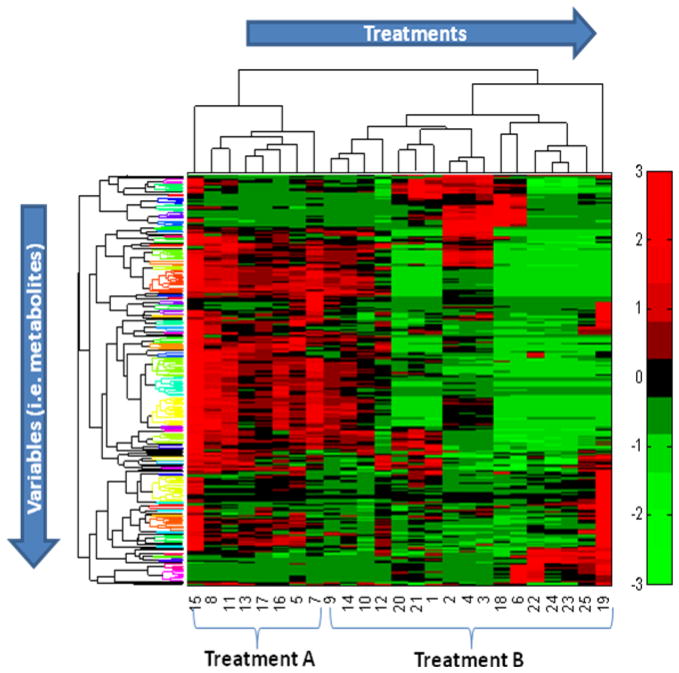
Figure 5.
A sample of an unsupervised clustering result for the analysis of metabolite profiles of 10 samples from the sample group D and 15 samples from the sample group DE. The threshold of the appearance frequency of each metabolite detected in all samples was set as ft = 75% and the PCA method was employed to reduce the data dimensionality. Fluctuations in the heat map are illustrated in the concentration of metabolites between treatments by color-scale. Two-dimensional hierarchical clustering analysis combined with heat map indicates the trends both in treatments and variables. The metabolite regulation grouped with same color in variables clusters reveals the similar attributes among them.

