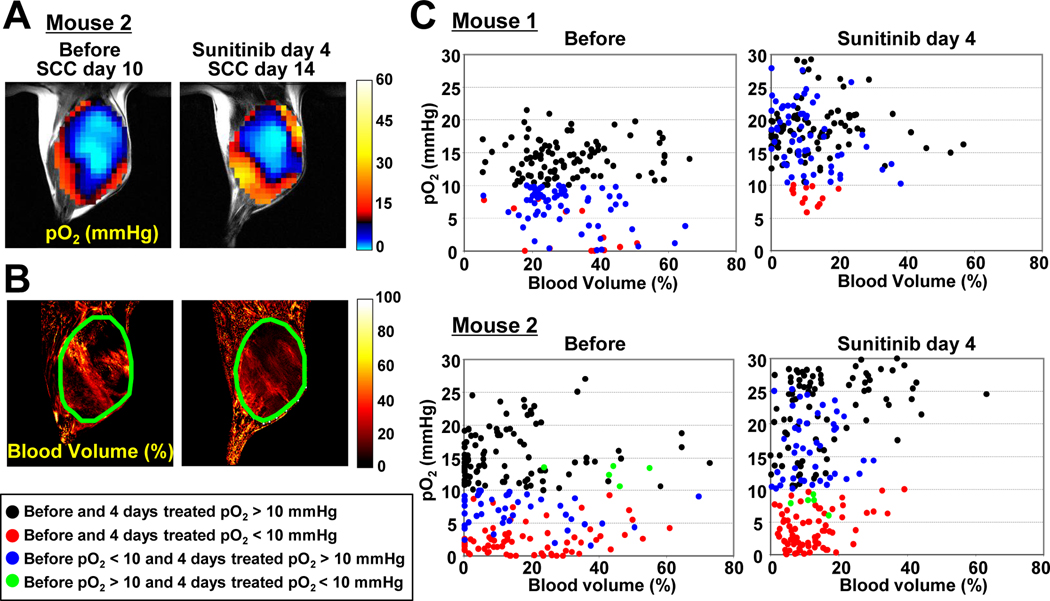
Figure 3.
Voxel-based trace of changes in (A) tumor pO2 and (B) blood volume of representative 2 mice, where the tumor size and shape were the same before and 4 days after sunitinib treatment initiated 10 days after tumor implantation. (C) Scatter plots of pO2 vs. blood volume in before (left column) and sunitinib treated (right column) mice. The data were classified into four groups: 1) pO2 >10 mmHg before and after 4 days sunitinib treatment (black symbols), 2) pO2 <10 mmHg before and after treatment (red), 3) pO2 <10 mmHg before and pO2 >10 mmHg after treatment (blue), 4) pO2 >10 mmHg before and pO2 <10 mmHg after treatment (green).

