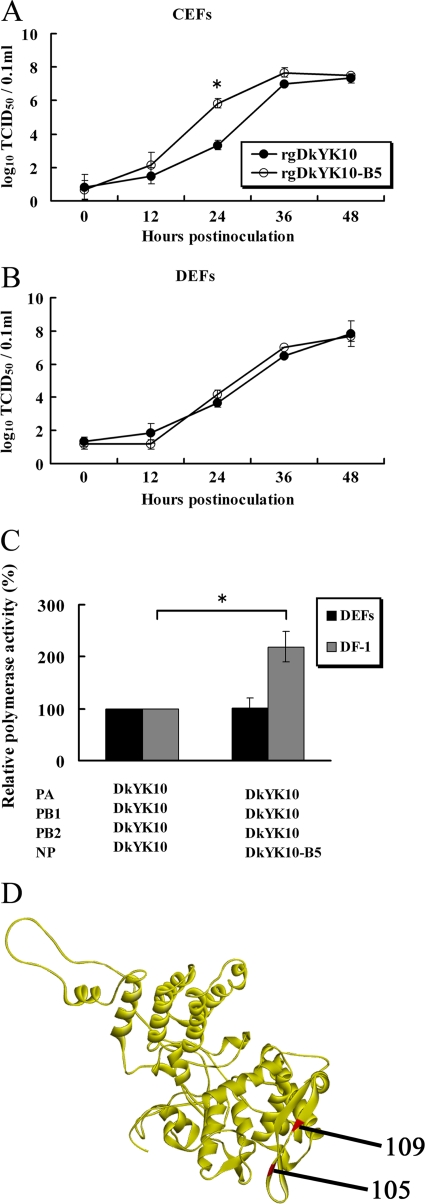
Fig. 4.
Comparison of the viral growth kinetics of DkYK10 and DkYK1-B5 in CEFs and DEFs and their polymerase activities in DF-1 cells and DEFs. (A and B) CEFs (A) and DEFs (B) were inoculated with gDkYK10 and rgDkYK10-B5 at an MOI of 0.001, and virus titers of the culture supernatants at each time point were determined with CEFs and expressed as an average of three wells per time point. (C) Polymerase activity in DF-1 cells and DEFs was assayed by cotransfection with pHH21-lucR reporter plasmid and pHW2000 plasmids containing the PB2, PB1, PA, and NP genes. Cells cotransfected with pHH21-luc and pHW2000 were used as controls. At 24 h after transfection, luciferase activity in the cell lysates was determined, and the mean counts per second (CPS) ± standard deviations of triplicate experiments were determined. The relative polymerase activity versus parental DkYK10 is shown. (D) The amino acids at position 105 identified previously (45) and at position 109 detected in this study are shown in the crystal structure of NP. *, significant difference (P < 0.05).

