
Fig. 1.
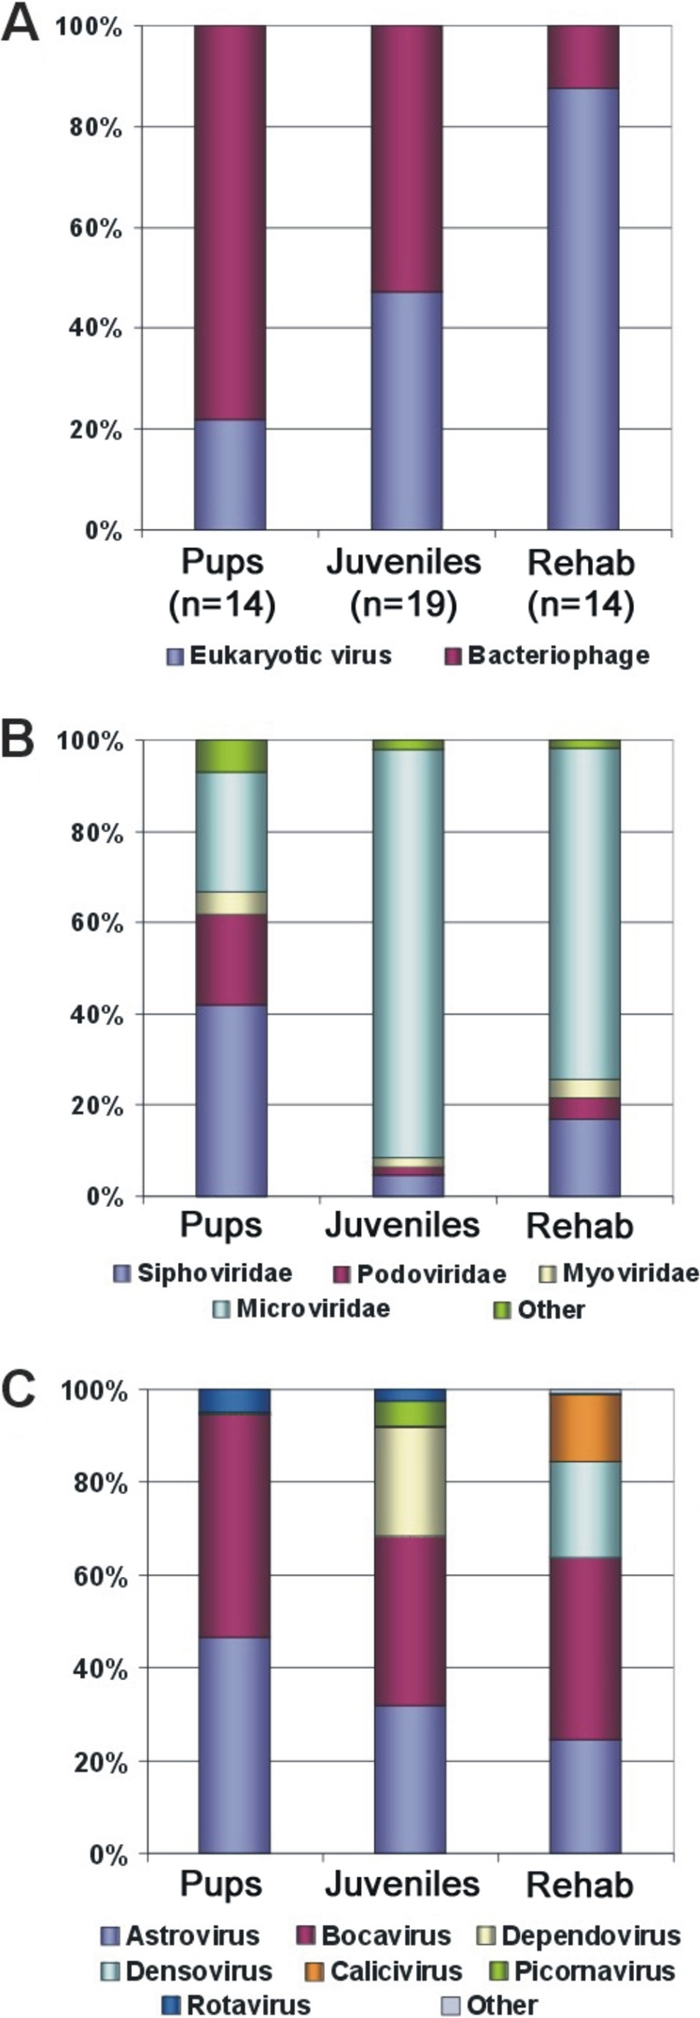
Virome comparisons for three California sea lion groups based on BLASTx comparison to the GenBank nonredundant database (E value of <0.001). (A) Percentage of virus-like sequence reads with similarity to bacteriophages and eukaryotic viruses. (B) Percentage of phage-related sequences in different viral families. (C) Percentage of eukaryotic virus-related sequences in different viral groups.