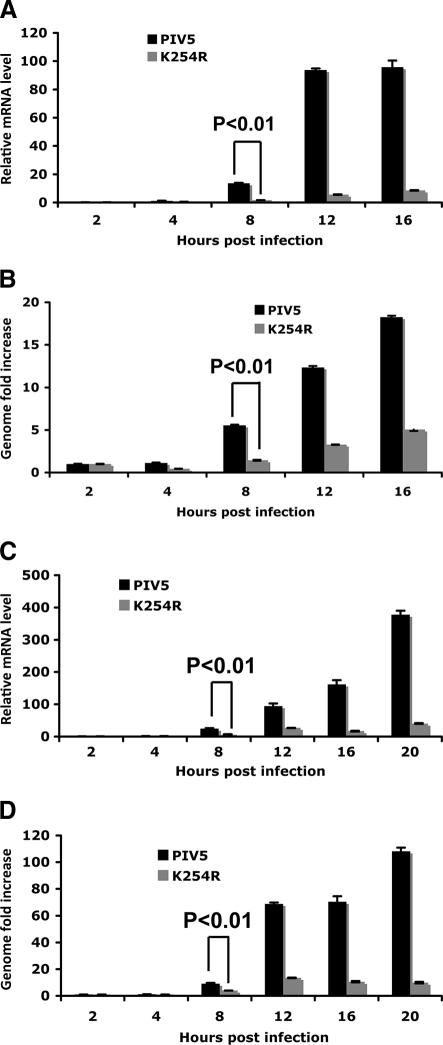
Fig. 6.
Viral RNA levels in rPIV5-P-K254R-infected cells. (A) Viral mRNA levels after high-MOI infection. MDBK cells were infected with PIV5 or rPIV5-P-K254R at an MOI of 3. The cells were collected at different time points for RNA extraction and real-time RT-PCR. Oligo(dT) was used for RT. The relative mRNA levels were normalized with the input genome defined as the viral genome at 2 hpi. (B) Viral genome levels after high-MOI infection. The same RNA from panel A was used for RT using BH191 annealing to the M gene of the viral genome. The cDNA was used for real-time PCR analysis. The genome level at 2 hpi was used as the baseline for normalization. (C) Viral mRNA levels after low-MOI infection. MDBK cells were infected with PIV5 or rPIV5-P-K254R at an MOI of 0.5. Total RNA was extracted from the cells at different time points for RT and real-time PCR analysis. (D) Viral genome levels after low-MOI infection. The same RNA from panel C was used for RT using BH191 to measure viral genome levels.

