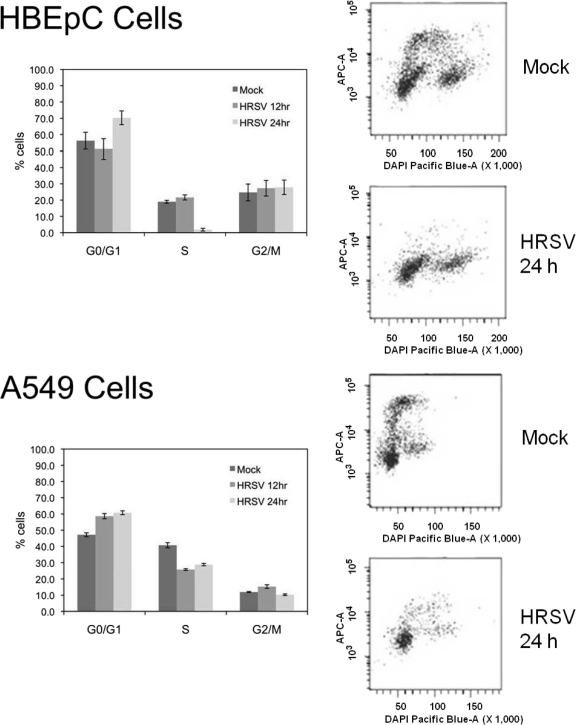
Fig. 3.
Cell cycle profiles for HBEpC and A549 cells dually stained with EdU and DAPI. (Left) Bars in histograms represent the mean percentages of cells in the G0/G1, S, and G2/M phases of the cell cycle in mock-treated and HRSV-infected cells at 12 and 24 h postinfection. (Right) Representative cell cycle profiles of dually stained (EdU/DAPI) mock-treated and HRSV-infected (24-h) HBEpC and A549 cells are shown for each experimental condition.

