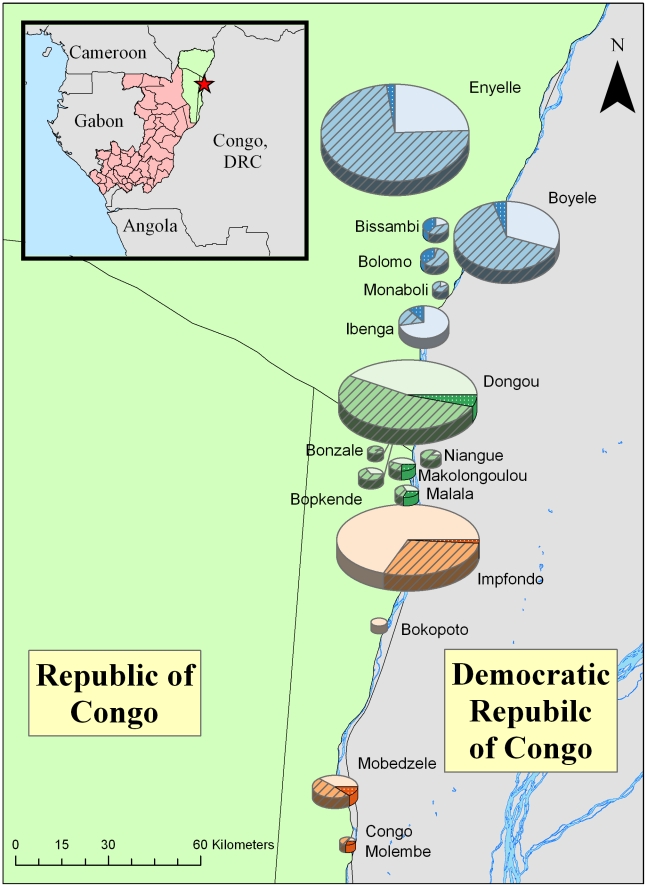
Figure 2. Community participation in the monkeypox outreach film screening events, COG, 2009.
Box inset highlights on the area of ROC in which the outbreak was performed. Each circle shown on the expanded map is a proportionally-sized representation of the villages and towns where films were shown. Villages and towns in the north, central and southern sectors are represented in blue, green and orange, respectively. The percent of the population attending the film presentations is represented by stripped and double-hatched sections, with the latter corresponding to small-group participants. Approximately 10% of those in the small groups were interviewed before and after seeing the films.

