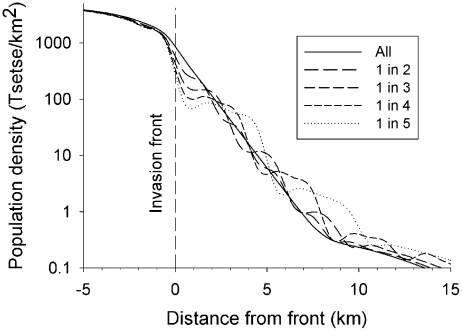
Figure 4. Distribution of tsetse after 1000 days of patchy control in the livestock farming scenario.
Abundance of adult females at various distances from the invasion front of Scenario L (livestock farming area), after 1000 days of control by baits killing an average of 10% per day, with treatment being spread over all bands or concentrated into 1 in 2, or up to 1 in 5 bands. The operational area first extended 32 km from the front, but was reduced as the population distribution contracted during the 1000 days; only part of the area is shown.

