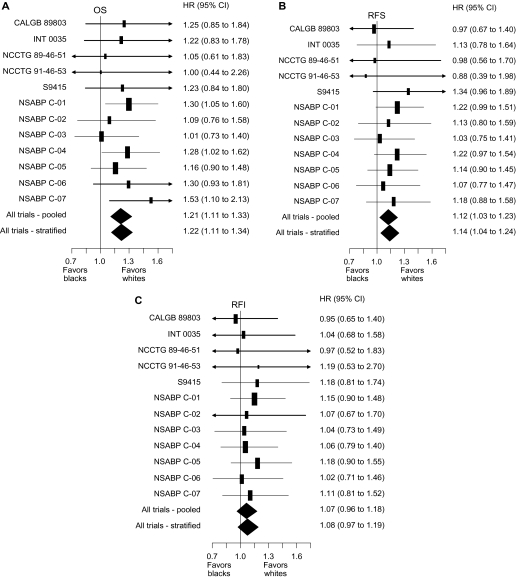
Figure 1.
Forest plots of hazard ratios (black divided by white) for death (overall survival [OS]), recurrence or death (recurrence-free survival [RFS]), and recurrence (recurrence-free interval [RFI]). The vertical lines indicate a hazard ratio of 1.0 (no difference between black and white race), values less than 1.0 favor black patients, and values greater than 1.0 favor white patients. Solid rectangles represent the hazard ratio of each single randomized controlled trial; the area of each rectangle is proportional to the inverse of the variance of the estimate. The horizontal line represents the 95% confidence interval and arrowheads indicate that the confidence interval extends beyond the scale of the plot. The solid diamonds represent the overall estimated hazard ratio based on multivariable Cox models of overall survival, recurrence-free survival, and recurrence-free interval controlling for sex, stage, age, and treatment, either not controlling for study (pooled) or stratifying by study (stratified); the diamond’s width represents the 95% confidence interval of the hazard ratio. A) OS. B) RFS. C) RFI. CALGB = Cancer And Leukemia Group B; CI = confidence interval; INT = Intergroup; NCCTG = North Central Cancer Treatment Group; NSABP = National Surgical Adjuvant Breast and Bowel Project.

