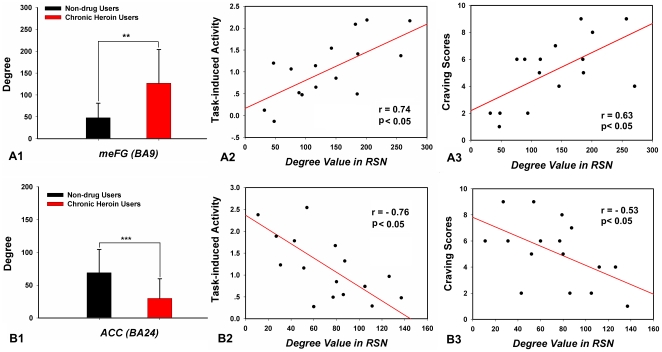
Figure 7. The bars are the degree comparisons between the two groups' resting state networks (RSN) in the medial frontal gyrus (meFG) (A1) and the anterior cingulate cortex (ACC) (B1).
Error bars are based on a 95% confidence interval. *p<0.01, **p<0.005. Scatter plots showing the correlation between the heroin-addicted individuals' degree values of the meFG (A2) and the ACC (B2) at rest and the same regions' neural responses induced by a heroin-related cue-reactivity task. Furthermore, the presences of resting deregulations of the meFG and the ACC were relevant to cue-induced craving scores (A3, B3).

