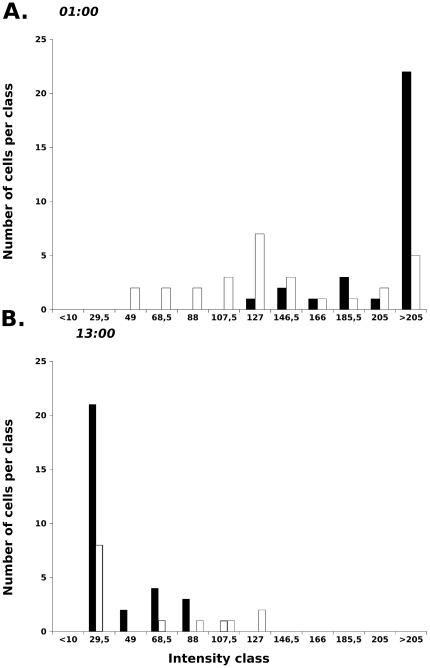
Figure 4. Distributions of intensity of labeling by anti-Survivin antibody of gastric cells after exfoliation (white bar) or within the gland (black bar) on hand-picked cells with a quiescent nucleus and a membrane labeling by H+/K+-ATPases-antibody.
The distributions of intensities of cells within the gland were widely different at 13H00 and 01H00 (note black bar positions on A and B). The level of survivin labeling of H+/K+ ATPase-positive cells by exfoliated cells and cells within the gastric gland, were similar at 01H00 (A) and 13H00 (B).

