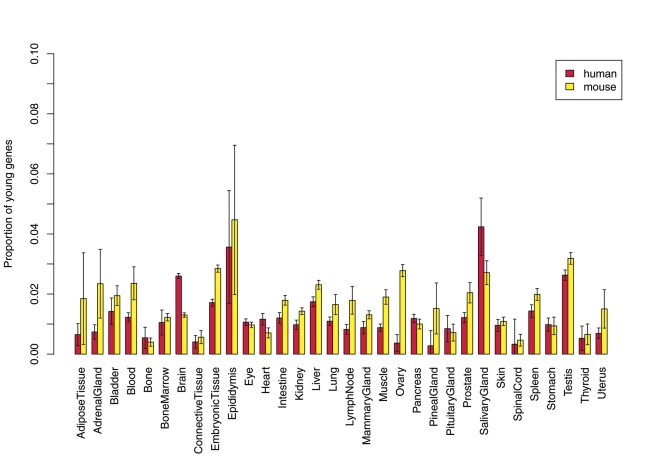
Figure 1. New gene contribution to various tissue transcriptomes.
The barplot shows the proportion of young genes out of all genes expressed in tissue or organ categories shared by UniGene human and mouse. For each category, mean and 2-fold standard deviation were plotted, which were generated with 100 bootstrapping replicates of background EST data. Only the brain shows a significant excess of new human genes based on Fisher's Exact Test (FET) with Bonferroni correction.

