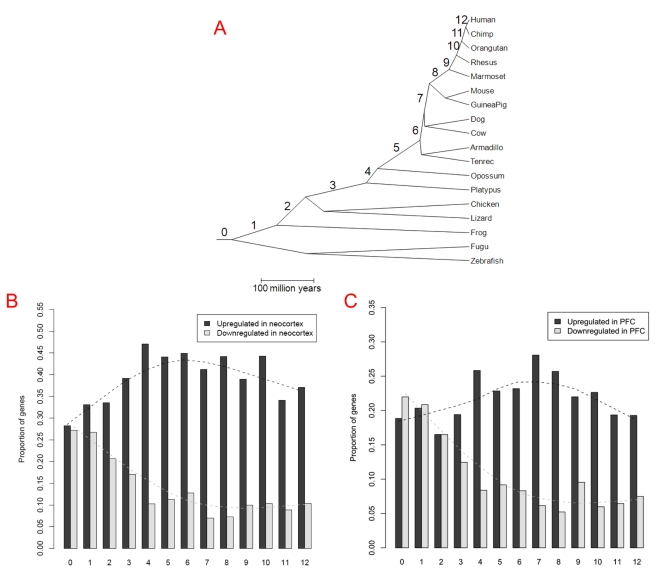
Figure 5. Proportion of genes differentially expressed between neocortex (or PFC) and the non-neocortical regions across different gene ages.
(A) The phylogenetic tree together with the branch assignments (0∼12) follows [19]. 0 indicates the oldest gene group, i.e. genes shared by all vertebrates, and branches 8∼12 indicate primate-specific genes, with branch 12 the human-specific lineage. (B) Proportion of genes differentially expressed between neocortex and non-neocortical regions, detected by exon arrays for genes originating in each branch. The dashed line shows the trend fit based on the lowess function of R [56]. (C) Genes with differential expression between PFC and non-neocortical control samples.

