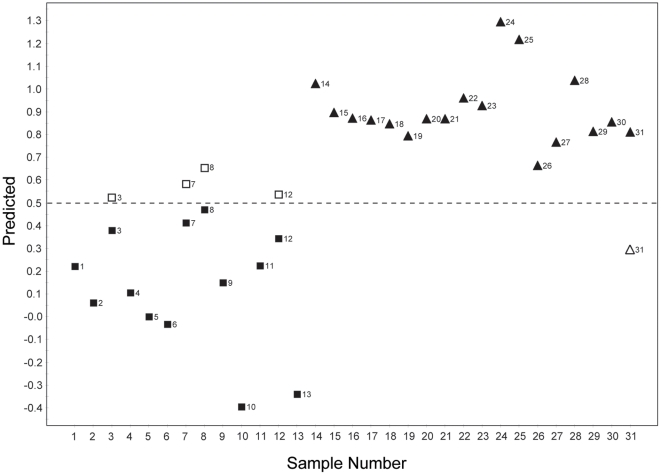
Figure 3. Prediction result for cancer status based on OPLS-DA model.
One patient sample was left out at a time, and a new OPLS-DA prediction model was constructed with the rest of the data. The class membership of the left-out samples was predicted using an a priori cutoff value of 0.5 (dashed line). Filled box: cancer samples, filled triangle: non-cancer samples. The Y values of the filled symbols are from the analysis using the entire dataset. In the case of mis-classified samples, the predicted Y values are also shown as open boxes (cancer samples) and open triangles (non-cancer samples).

