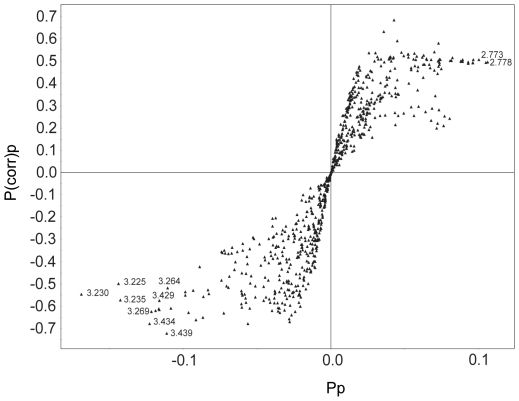
Figure 4. Signals contributing to differentiation.
Signals contributing to the differentiation of cancer and non-cancer samples are plotted based on their p(corr)p and p p values. These values represent modeled correlation and modeled covariation, respectively. The most relevant chemical shift values are shown next to the symbols representing the signals.

