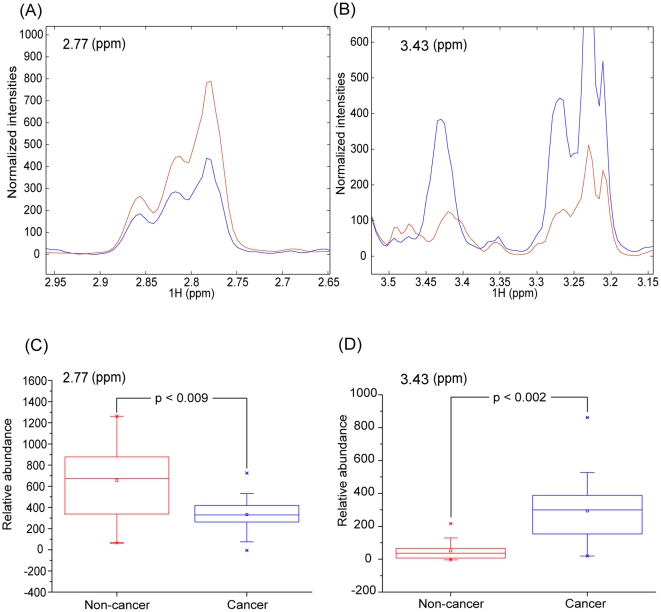
Figure 5. Average spectra and Mann-Whitney U test for marker signals.
The levels of the makers identified by the multivariate analysis were assessed by average spectral plot and Mann-Whitney U-test. A and B: Normalized and averaged intensities of the indicated marker signals from the cancer and non-cancer samples. C and D: Box plots of the Mann-Whitney U test results with the resulting p values. In all of the plots, red represents the non-cancer samples and blue the cancer samples.

