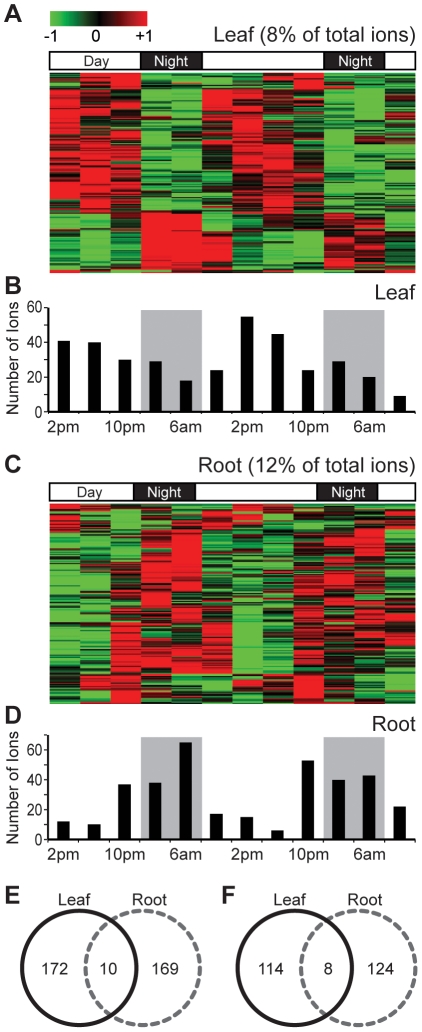
Figure 2. Accumulation of oscillating metabolites in N. attenuata show tissue-specific rhythms.
Oscillating metabolites in source leaves (A) and roots (C) were roughly divided into two groups, one peaking during the day, and the other peaking at night. The heat map displays all of the Z-transformed oscillating metabolites levels in a false-color scale where green indicates low and red indicates high values. Each metabolite is represented by a single row with the average linkage hierarchical clustering tree obtained using Euclidean distances as metric. We counted the number of ions (y-axis) that peak at a particular harvest times (x-axis) in source leaves (B) and roots (D). Gray boxes depict the dark period. (E) Venn diagram of the oscillating metabolites selected across source leaves (black solid line) and roots (gray dashed line). (F) Venn diagram of the oscillating metabolites after removing adduct and daughter ions. CAMERA package and Pearson correlation [17] were used to select adduct and daughter ions detected from extracts of source leaves (black solid line) and roots (gray dashed line).

