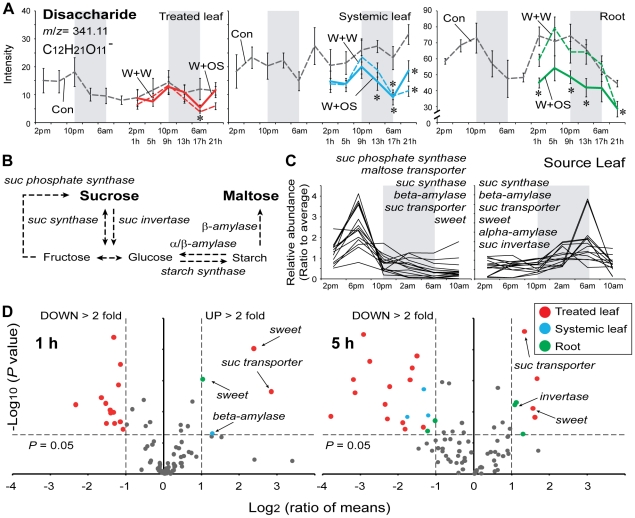
Figure 3. Accumulation of disaccharides and sugar related genes in three different tissues.
(A) Mean (±SE) levels of normalized intensity of disaccharides (m/z 341.11 at 90 s, C12H21O11 −) in source leaves, sink leaves and roots at each harvest time for two days (gray dashed lines) in control (Con) plants. After wounding and treating puncture wounds with either water (W+W, dashed lines with colors) or M. sexta OS (W+OS, solid lines with colors), disaccharides levels were examined in treated leaves (red), untreated systemic leaves (blue) and roots (green). Gray boxes depict the dark period. Asterisks indicate significant differences among the treatments at the indicated harvest time (* = P<0.05, one-way ANOVA with Bonferroni post hoc test). (B) Schematic overview of sucrose (suc) metabolism. (C) Two diurnal patterns of sugar metabolism-related genes (Table S2) accumulation in source leaves. Gray boxes depict the dark period. Sweet: sugar exporter [23]. Ratio to average: Ratio of transcript abundance at the time point shown, to the mean abundance of the same transcript across all time points. (D) Volcano plot analysis of the transcript levels of sugar-related genes in treated leaves (red dot), systemic untreated leaves (blue dot) and roots (green dot) 1 and 5 h after M. sexta OS-elicitation. The log2 ratio of mean intensities (OS-elicited/Con, with microarray expression data) plotted against the negative log10-transformed P value derived from Student's t tests. The horizontal dashed line indicates the threshold for statistically significant expression at P = 0.05 and the vertical dashed line, the threshold for two-fold changes in gene expression.

