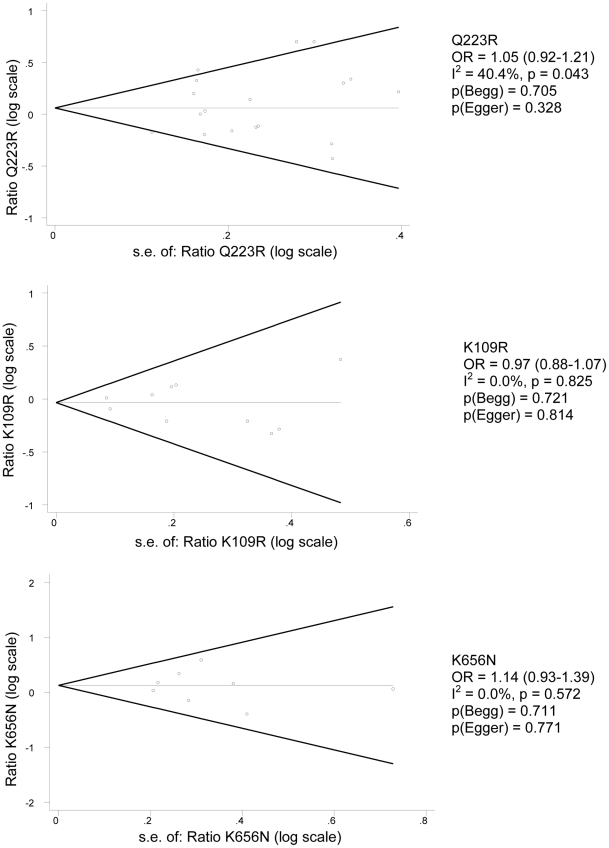
Figure 2. Begg's funnel plots of study precision.
For included studies on the association between Q223R, K109R and K656N and overweight, Begg's funnel plots were used to examine a possible small study bias. The natural logarithm of the odds ratio (OR) vs. its standard error and pseudo 95% confidence intervals are shown, together with Begg and Egger statistics.

