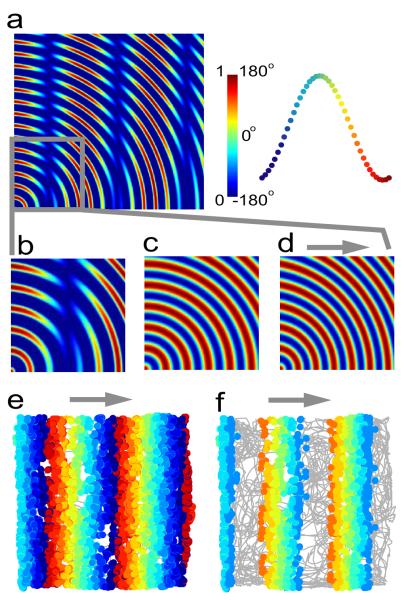
Figure 2.
Linear interference patterns in 2D. a) Interference between a velocity-controlled oscillator (VCO) and a baseline oscillation during constant velocity runs from the origin (bottom left). Expanded view (b-d) shows the baseline oscillation (c) and the VCO (d, grey arrow shows preferred direction). Both component oscillations are sinusoidal and the combined oscillation is the thresholded sum (a, b). See Details below and Burgess et al. (2007). e) The firing of a neuronal VCO as the rat follows a 10min foraging path (grey line) in a square box. The VCO fires spikes at the peaks of its membrane potential oscillation (MPO). The locations of spike firing are show colored by the phase of firing relative to the baseline oscillation. See Details below. f) The firing of the neuronal VCO in (e) when its MPO is modulated by the baseline oscillation and a firing threshold of 0.5 is applied. Details: The baseline oscillation is Vb(t)=(1+cos{2πfbt})/2, the VCO is: Va(t)=(1+cos{2πfat})/2, where fb = 8, fa= fb + βv(t).d, β=0.05, and d is a unit vector in the preferred direction (rightwards). In (a-d) ν(t) is a constant 30cm/s to the location of each pixel. The thresholded sum: [Va(t)+Vb(t)-F]+ is shown in (a), with threshold F=1. In (e-f) ν(t) is the velocity of the rat, spikes are fired at the peaks of Va(t) in (e) and colored to show phase of firing relative to Vb(t). In (f) spikes are fired as in (e), but only if Va(t)*Vb(t) exceeds a firing threshold F=0.5. Color bar (top right) shows amplitude (0-1) and phase. Figure 2a is adapted from Burgess et al. (2007).

