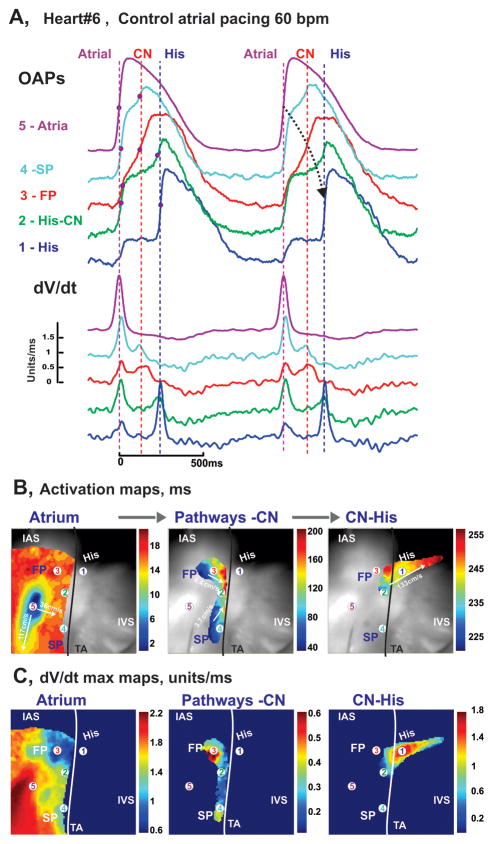
Figure 2.
Optical mapping of AVJ #6 during atrial pacing. Panel A: OAPs and their derivatives recorded from sites 1–5 in panels B and C, during atrial pacing at 60 bpm (CL=1000ms). Red dots on OAP upstrokes correspond to dV/dt peaks. Panel B: Separated atrial, AV nodal, and His bundle activation maps superimposed on the OFV (30×30 mm2). The black line demarcates the TA.

