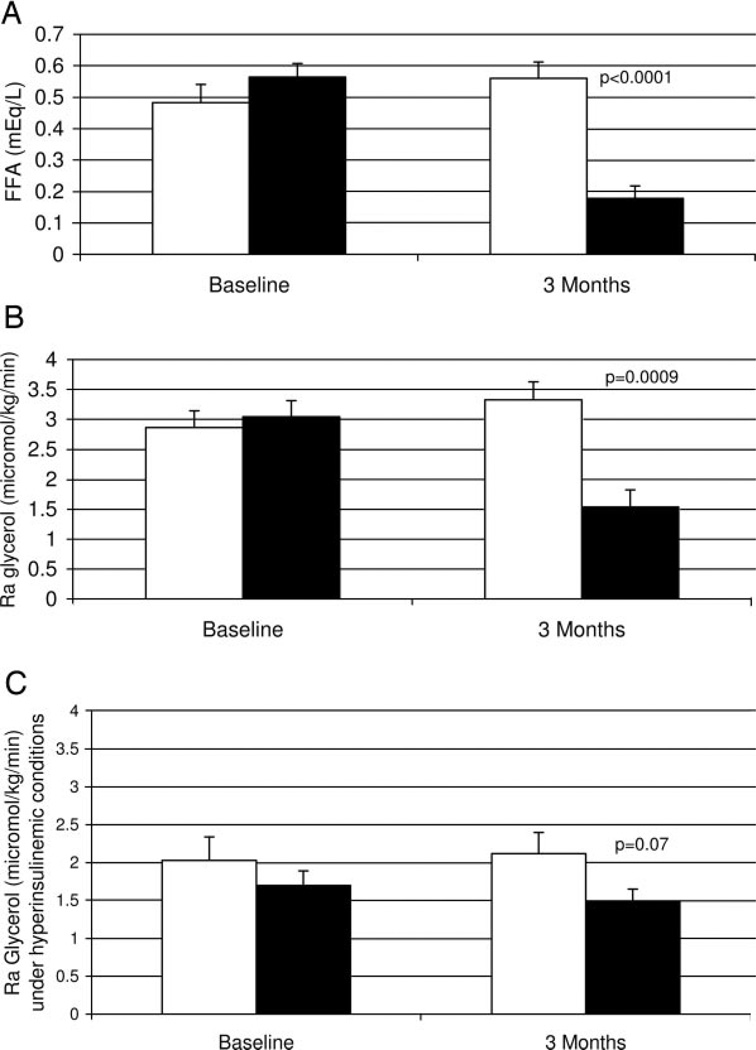
Fig. 2.
Baseline and 3-month FFA concentrations (A) and basal lipolysis (B) measured by Ra glycerol and Ra glycerol during hyperinsulinemic clamp (C) with placebo (open bars, n=10) and acipimox (solid bars, n=11). P values represent the results of t tests between groups at 3 months; there were no differences between groups at baseline.

