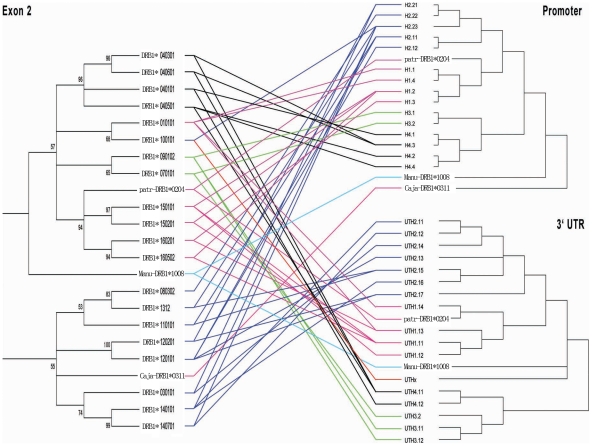
Figure 2. Linkage Relationship between Promoters, Exon2 and 3′-UTRs.
Branch lengths for all trees are arbitrary, and Bootstrap values larger than 50% are shown on the nodes. The three parts located on the same haplotype were connected with lines. The different color lines denote the deeply separated lineages.

