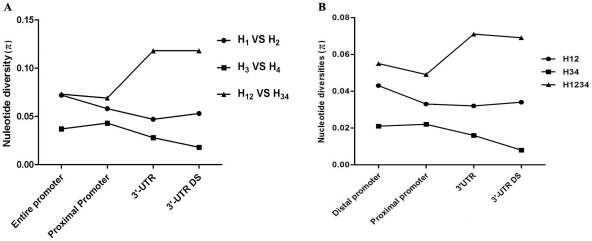
Figure 3. Comparison of Nucleotide Diversity between Different Lineages or lineage combinations in Various Regions.
H12 represents a lineage combination with lineage 1 and lineage 2; H34 denotes a lineage combination with lineage 3 and lineage 4; H1234 indicates a lineage combination with all lineages. A: The nucleotide diversity was calculated by averaging the polymorphic site within the compared lineages. B: The average nucleotide diversity (per site per sequence) was computed.

