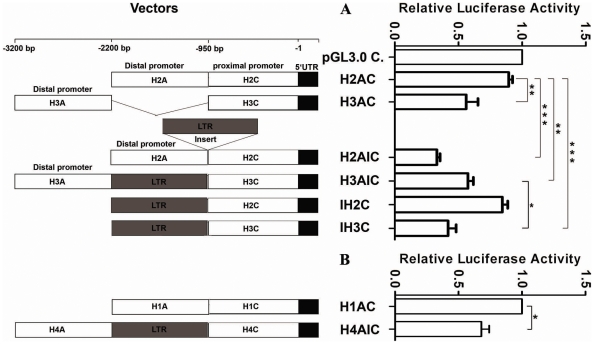
Figure 5. Relative Luciferase Activity under the Control of DRB1 Promoters with or without a LTR Insert.
The strategy for constructing the promoter vectors is shown on the left and the relative luciferase activity of corresponding vectors is shown on the right. H1, H2, H4 and H4 represent the sequences derived from promoter lineage H1, H2, H3 and H4 of DRB1, and A, C denotes the distal promoter segment and proximal promoter segment, respectively. “I” denotes the insert LTR actually located at H3 lineage about 950 bp upstream from the transcription start site. Firefly luciferase activity of each sample was normalized by Renilla luciferase activity. The pGL3.0 control vector (A) and H1AC (B) is used as controls, and the normalized luciferase activity of control was set as relative activity 1. Therefore no error bar was shown for pGL3.0 control vector and H1AC. The relative luciferase activity of the other samples was calculated by their normalized luciferase activity to that of the normalized control. Error bars represent standard error of the mean estimated from three replicate experiments. *, P<0.05, **, P<0.01; ***, P<0.001, comparison between two groups as indicated.

