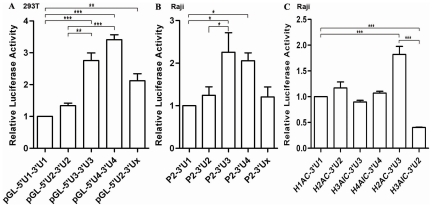
Figure 6. Luciferase Activity was Detected for the 3′-UTR from Different HLA-DRB1 Lineage.
A: Luciferase activity was detected in 293T cells for the plasmids into which different DRB1 lineage-derived 3′-UTRs were inserted downstream the reporter gene. B: Luciferase activity was detected in Raji cells for the plasmids into which a same DRB1 promoter sequence and different DRB1 lineage derived 3′-UTRs were simultaneously cloned up and downstream of the reporter gene, respectively. C: Luciferase activity was detected in Raji cells for the plasmids into which the naturally linked long promoter sequence and 3′-UTR from DRB1 lineages were simultaneously cloned up and downstream of the reporter gene, respectively. The construct of H2AC-3′U3 represented the plamids that the promoter and 3′-UTR of the reporter gene were derived from DRB1 lineage 2 and lineage 3, respectively. But the construct of H3AIC-3′U2 was just reverse to H2AC-3′U3. Firefly luciferase activity of each sample was normalized by Renilla luciferase activity. The pGL-5′U1-3″U1 (A), P2-3′U1 (B) and H1AC-3′U1 (C) is used as controls, and the normalized luciferase activity of control was set as relative activity 1. Therefore no error bar was shown for pGL-5′U1-3″U1, P2-3′U1 and H1AC-3′U1. The relative luciferase activity of the other samples was calculated by their normalized luciferase activity to that of the normalized control. Error bars represent standard error of the mean estimated from three replicate experiments. * P<0.05, ** P<0.01 and *** P<0.001 are indicated as the comparative significancce between two groups.

