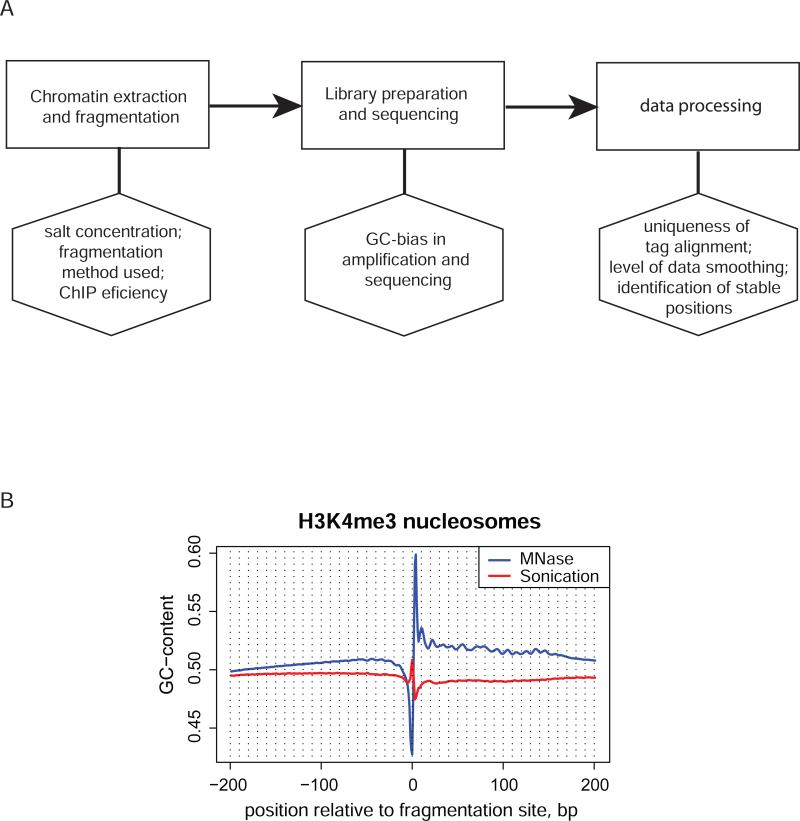
Figure 3.
Possible biases in the sequencing experiment. A. Flow chart showing major stages of the nucleosome profiling experiment (upper row, rectangles) and internal biases that may be associated with them (lower row, hexagons). B. GC-content profile of the sequences around fragmentation sites determined in two independent ChIP-seq experiments profiling H3K4 tri-methylated nucleosomes in human. Blue line represents the data obtained for MNase digested chromatin from CD4+ T-cells [23] and red line represents the data obtained for sonicated chromatin from HeLa cells [26]. Only the tags mapped to unique regions of human genome, as defined in UCSC genome browser [70;71], were taken for analysis to avoid possible bias when repetitive sequences are included. The DNA fragmentation was performed with MNase digestion of native chromatin in the case of CD4+ T cells and with sonication of cross-linked chromatin in the case of HeLa cells. Note the difference in the characteristic patterns at the fragmentation site and the overall GC-content of the two sequence sets.

