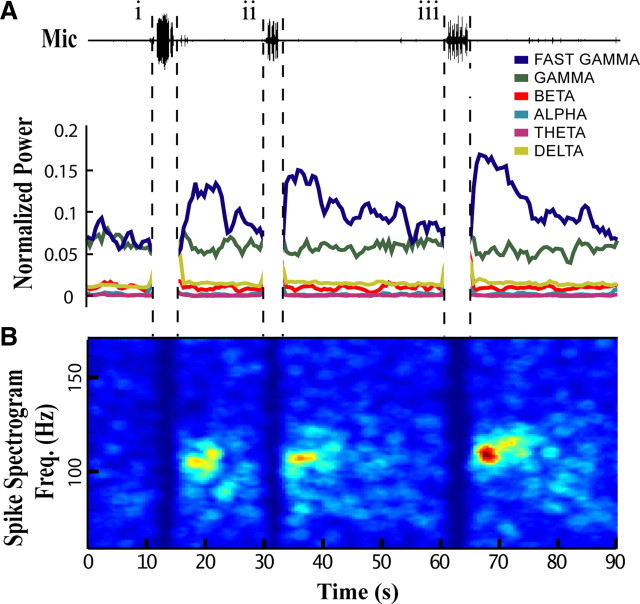
Figure 3.
Vocal activity induces fast gamma oscillations in NIf. Representative 90 s epoch during which the subject vocalized several times. Each vocal bout is followed by a selective and long-lasting increase in fast gamma power. A, Microphone (Mic) trace showing the location of the three vocal bouts (i, ii, and iii): (i) a string of 12 closely spaced long calls; (ii) a song bout with 3 motifs; and (iii) a song bout with 5 motifs. Plotted below is the normalized power calculated from multiunit spike times in 2 s sliding windows (75% overlap) across named frequency bands: Delta, 1–3 Hz; Theta, 4–8 Hz; Alpha, 8–14 Hz; Beta, 15–30 Hz; Gamma, 30–90 Hz; Fast Gamma, 90–150 Hz. B, Spectrogram calculated from MUA demonstrating the distribution of power increases across fast gamma and other frequencies for the same time period as that in A. The peak frequency (Freq.) of oscillation for this subject was ∼110 Hz. Each subject had a characteristic distribution of power increases across the fast gamma band in the Post-Vocal period. Spectrogram values were smoothed for display purposes (pillbox filter, 3 Hz × 1.5 s). Warmer colors represent greater power/Hz. In both A and B premotor activity has been removed because power during vocal activity is dominated by the temporal spacing of premotor bursts, which is largely a reflection of call spacing or the syllabic structure of individual songs.

