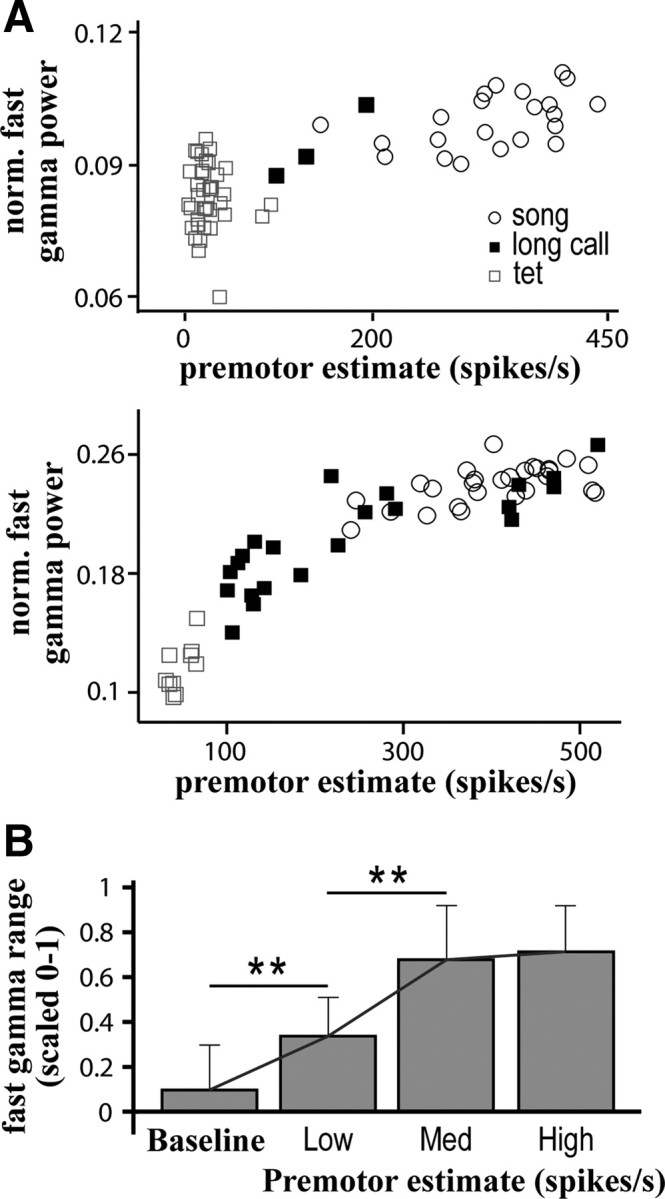
Figure 8.

Premotor activity is positively correlated with fast gamma power. A, Scatter plots demonstrate the positive correlation between normalized (norm.) fast gamma power and average premotor firing rate for exemplar sites in two different birds. For each vocal offset, an estimate of premotor firing (see Materials and Methods) during the preceding 5 s is plotted against normalized fast gamma power in the Post-Vocal period. The vocalization type preceding each measurement window is indicated. B, Normalized fast gamma power nears its maximal value following the level of premotor activity typically produced during a bout of song. For comparison across sites and birds, fast gamma power and premotor firing estimates were normalized between 0 and 1 based on the minimal and maximal measurements at each individual site. These normalized values were used to divide premotor firing estimates into three bins: Low (0–0.33), Medium (0.33–0.66), and High (0.66–1). Normalized fast gamma power associated with the premotor estimates in each bin was averaged, and these values were used to calculate a grand average across all sites. Even small amounts of premotor activity cause a significant increase in fast gamma power when compared to baseline (**p < 0.01, t test). However, fast gamma power saturates before premotor activity estimates reach maximal values. Most of the variation in fast gamma power is found at lower concentrations of premotor activity.
